Library & Reading Statistics
The Profile page gives you a detailed picture of your library and your reading habits across two tabs: Library Statistics and Reading Stats.
Navigate there by clicking your username or avatar in the top navigation bar.
Library Statistics
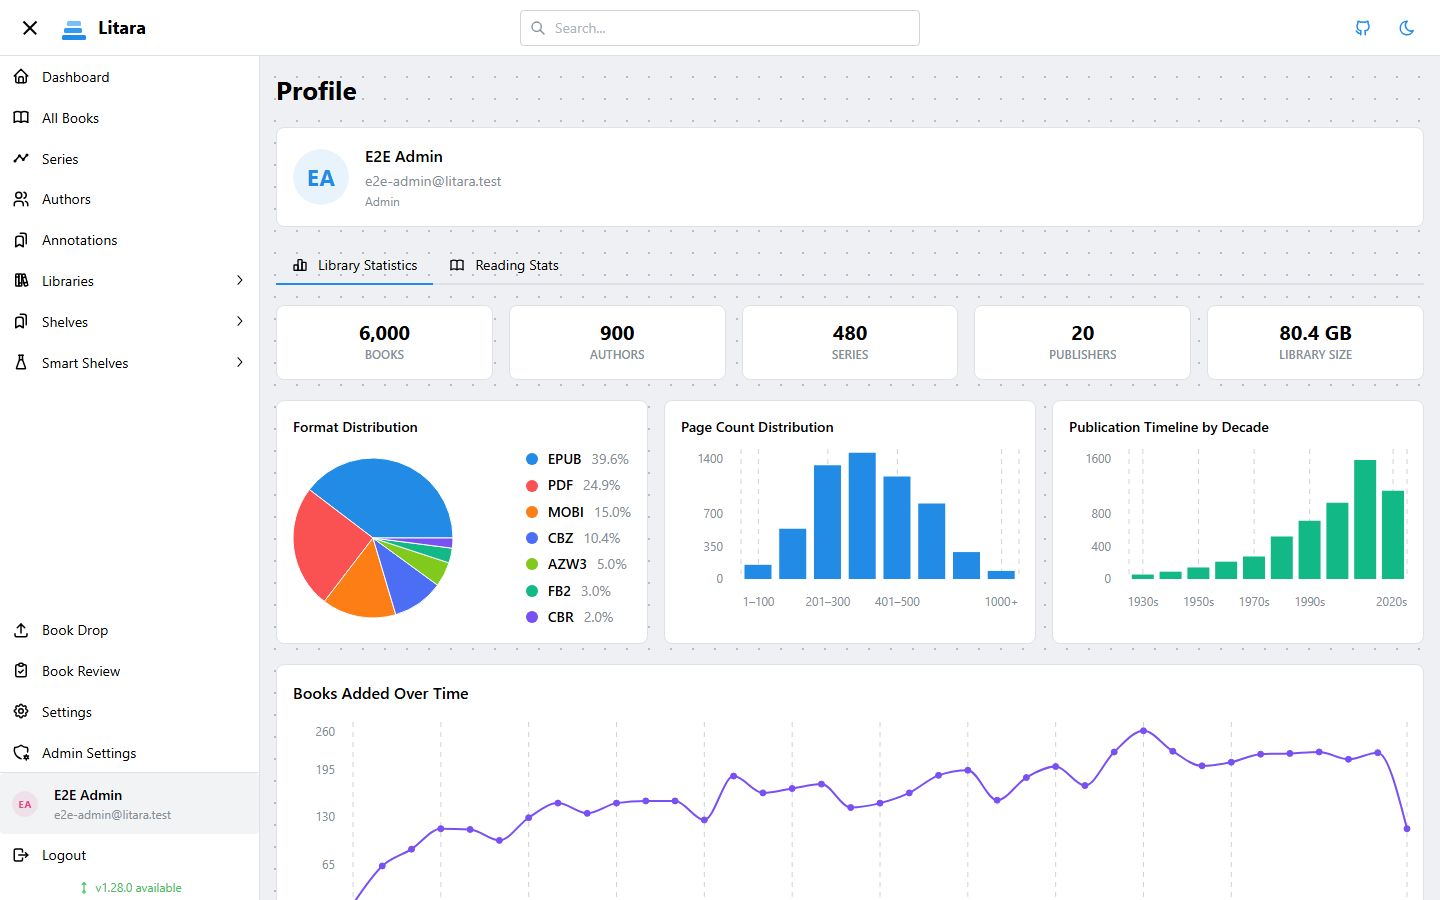
The Library Statistics tab shows an overview of your entire collection.
Overview cards
Five summary cards appear at the top:
| Card | What it shows |
|---|---|
| Books | Total number of books in your library |
| Authors | Number of distinct authors |
| Series | Number of distinct series |
| Publishers | Number of distinct publishers |
| Library Size | Combined file size of all books on disk |
Format Distribution
A pie chart breaking your library down by file format (EPUB, PDF, MOBI, CBZ, AZW3, FB2, CBR). Each segment is colour-coded, with a legend showing the exact count and percentage for each format.
Page Count Distribution
A bar chart grouping books into page-count buckets (e.g. 0–100, 101–200, …, 800+). Useful for seeing whether your library skews toward shorter reads or longer ones.
Publication Timeline
A bar chart showing how many books in your library were published per decade, from the 1930s onward. Books with no publication date are excluded.
Books Added Over Time
A line chart showing how many books were added to Litara each month. This reflects when files were imported into the library, not when they were published.
Reading Stats
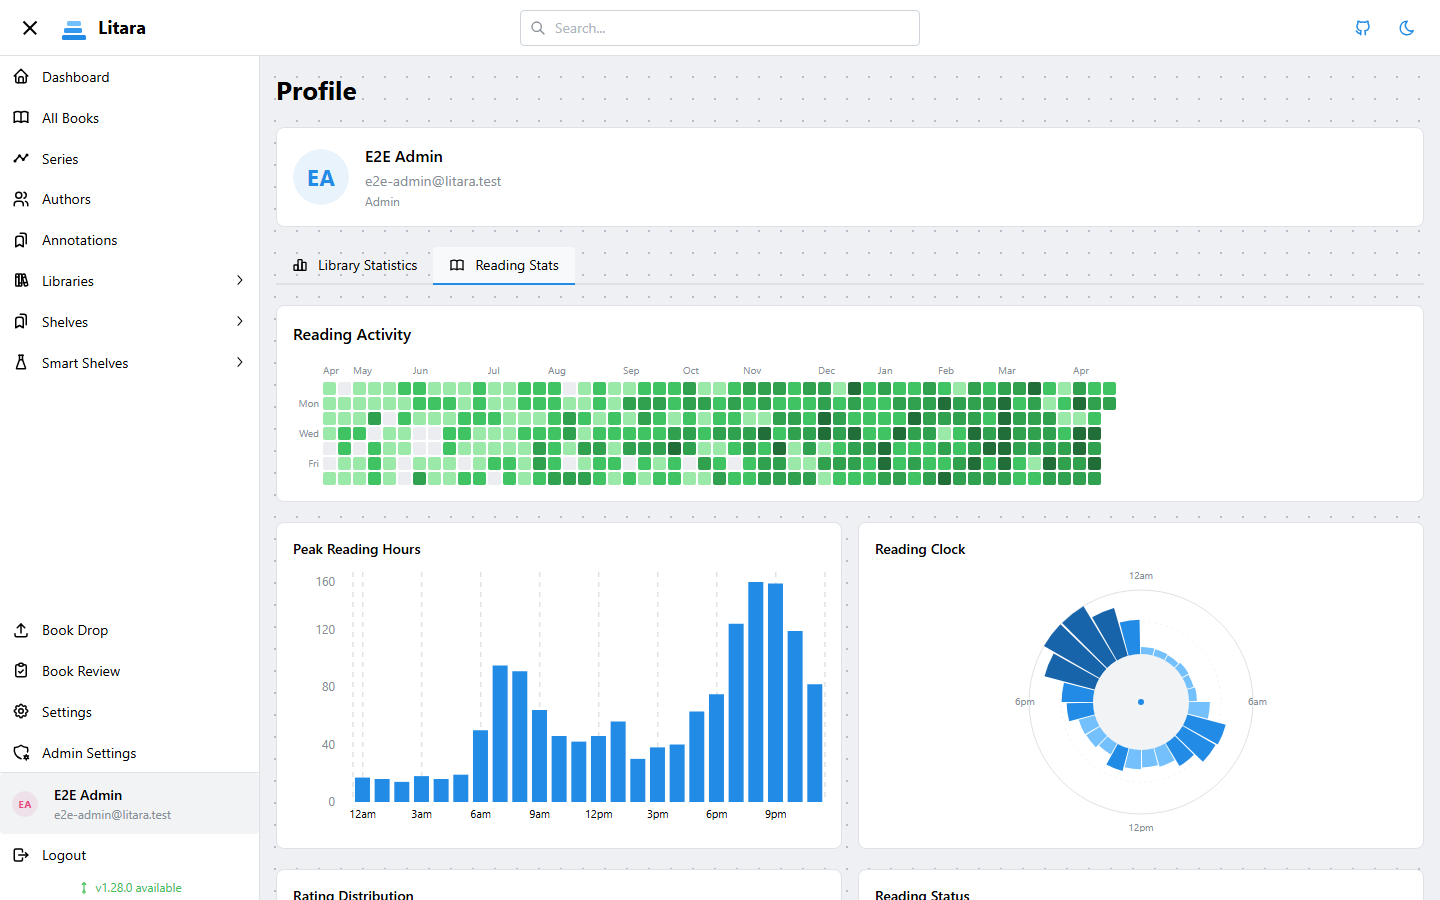
The Reading Stats tab tracks your personal reading activity — how often you read, when you tend to read, how you rate books, and the breakdown of your reading statuses.
Reading activity is recorded whenever your reading progress is synced — either by using the built-in reader or via KOReader sync. The more you sync, the richer these charts become.
Reading Activity
A GitHub-style heatmap spanning the last 52 weeks. Each cell represents one day; darker green means more reading sessions synced on that day. Hover over any cell to see the exact date and session count.
Peak Reading Hours
A bar chart across all 24 hours of the day showing how many reading sessions were recorded at each hour. This reveals your natural reading rhythm — whether you're an early-morning reader, a lunch-break reader, or a late-night reader.
Reading Clock
A polar area chart (rose diagram) that displays the same hourly data as a 24-hour clock face. Each of the 24 wedges represents one hour; the wedge extends outward in proportion to how many sessions occurred at that hour. Colour intensity deepens from light to dark blue as activity increases.
- 12am is at the top (12 o'clock position)
- 6am is at the right (3 o'clock position)
- 12pm is at the bottom (6 o'clock position)
- 6pm is at the left (9 o'clock position)
Rating Distribution
A bar chart showing how many books you have rated at each star value (0–5, in 0.5 increments). Only books with a rating set in their review are counted.
Reading Status
A pie chart showing the breakdown of your books by read status:
| Status | Meaning |
|---|---|
| Reading | Currently in progress |
| Read | Finished |
| Unread | Not yet started |
| Won't Read | Marked as skipped |
The percentage shown next to each status is relative to your total reviewed books.